
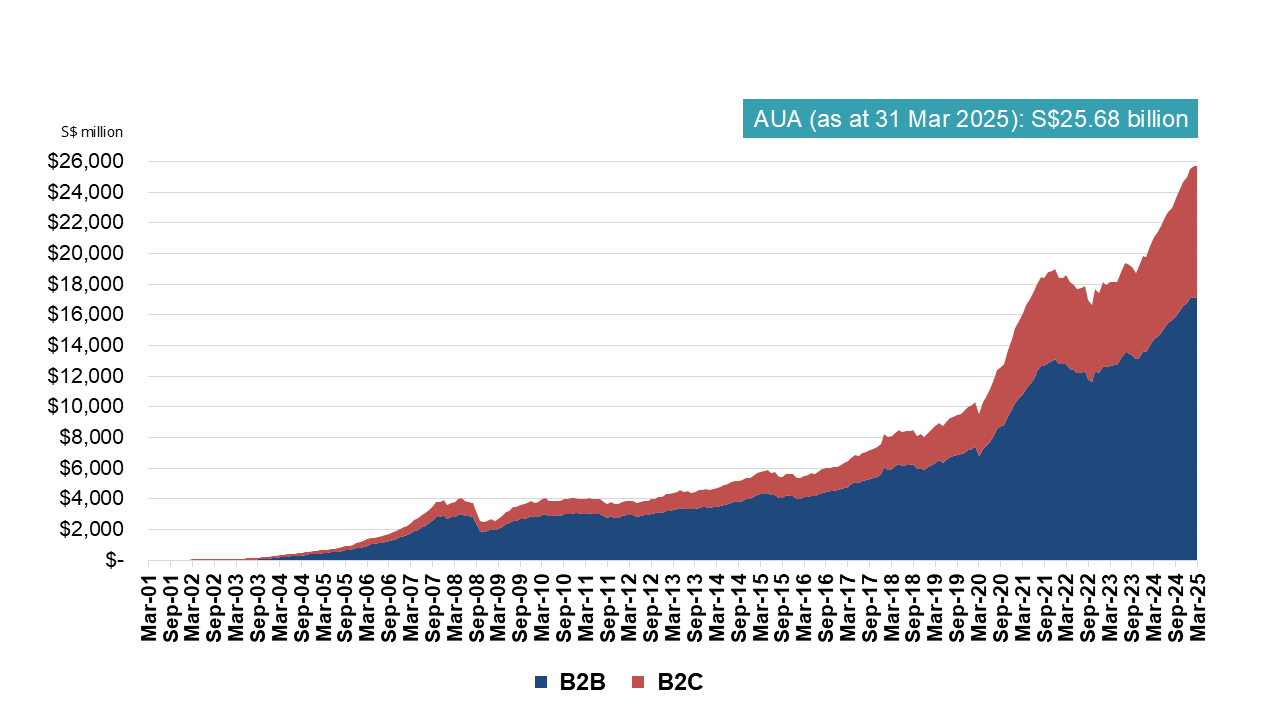
Group AUA
Total Net Revenue* Breakdown
between Recurring and Non-recurring Sources
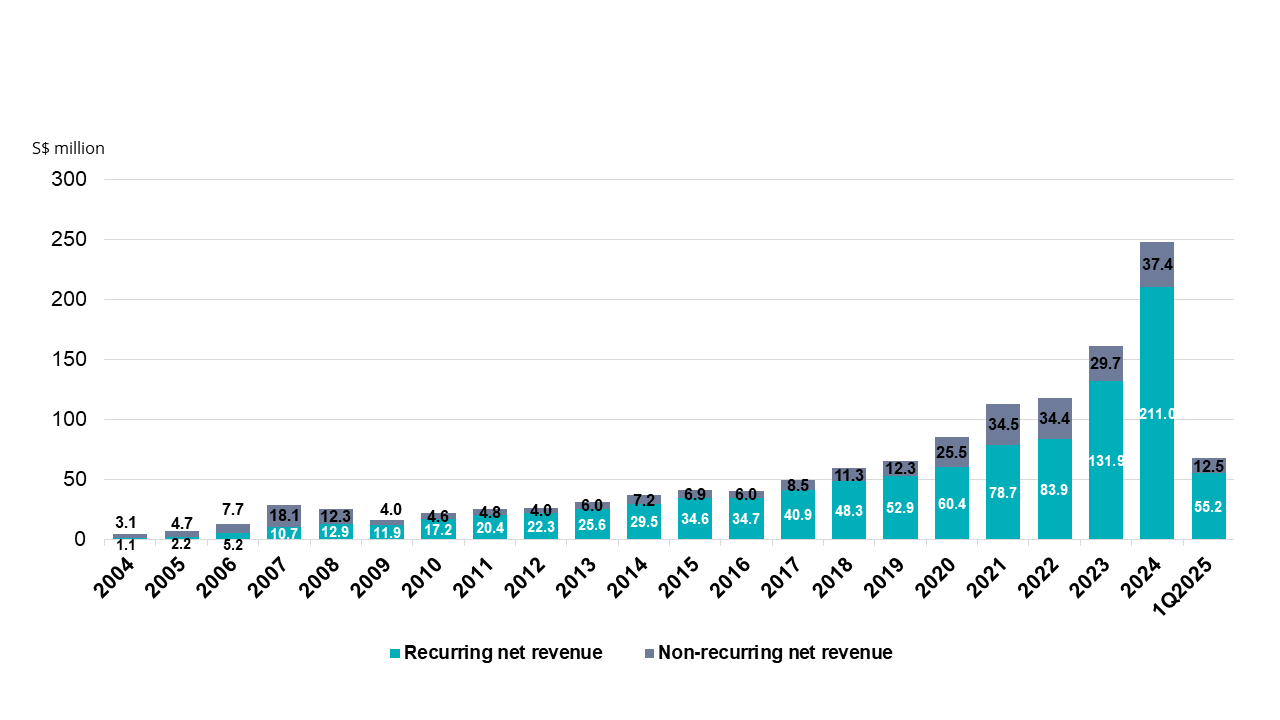
Average contribution from recurring net revenue as opposed to non-recurring net revenue in the period from 2023 to 2024 was 83.6%.
*Note: Including the new banking operation in 2022.
PBT Margin for Group (based on Total Net Revenue)
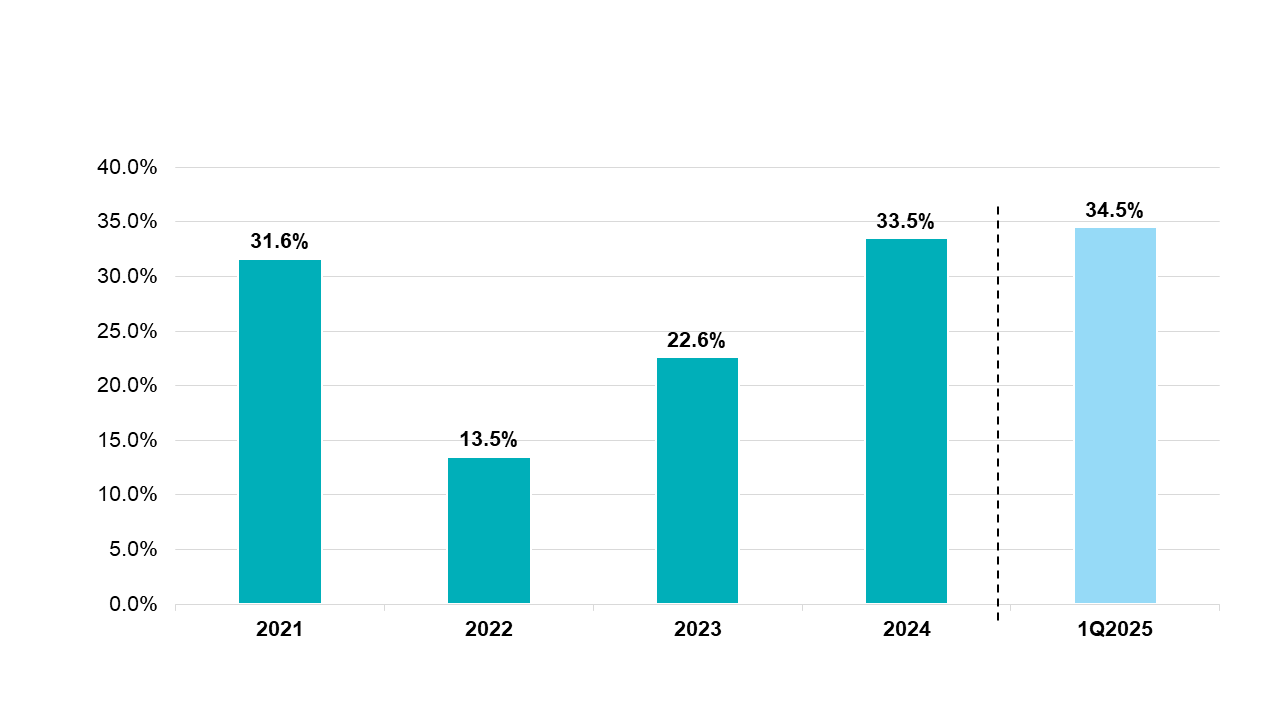
*Note: Includes the new banking operation for FY2022 and excludes impairment loss of S$5.2 million related to India Business recognised in 2Q2022.